


Data for each U.S. state shows which groups of drivers are getting into the most car crashes

An interesting new study reveals the race and the age range of U.S. drivers that are getting into the most car accidents. That same report also shares the gender, height and weight of those accident-prone drivers and which U.S. states are home to the drivers of those car crashes.
Spoiler alert: the study reveals data showing that White males between the ages of 21 and 25 are more likely to get into a car accident. This latest report also shares some surprising data regarding who is more likely to get into a car accident for each state in the U.S.
The study, conducted by personal injury lawyers Neufeld Lawfirm, analyzed data regarding age, sex, race, height, and weight from the Fatality Analysis Reporting System to discover which demographic got into the most car accidents in the United States in 2021.
On a national scale, white males between 21 and 25 seem statistically more likely to get into a car crash with 3,036 car accidents in 2021, followed by 26- to 30-year-olds with 2,958 accidents and 31- to 35-year-olds in third place with 2,821.
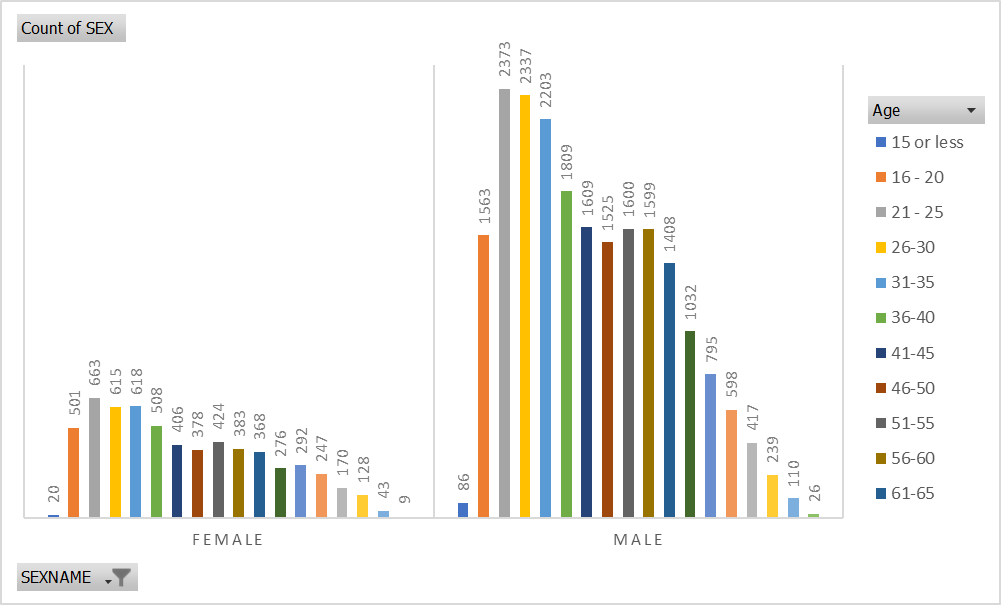
Regarding sex, male drivers are much more likely to crash their cars compared to female drivers, regardless of age and race. In fact, in 2021, male drivers were in 21,329 fatal crashes as opposed to 6,049 accidents where a female was driving.
This is even clearer when the number of crashes is compared to the licensed population of the United States of each sex: out of 117,566,578 female drivers there have only been 6,049 fatal crashes, resulting in a rate of 5.1 crashes per 100,000 licensed population. However, out of 115,215,219 licensed men there have been 21,329 accidents, resulting in a rate of 18.5 crashes per 100,000 licensed population.
| Rate of fatal crashes compared to US licensed population of each sex | |||
| Gender | Licensed population | Total number of fatal crashes | Fatal crashes of drivers per 100k licensed population |
| Male drivers | 115,215,219 | 21,329 | 18.5 |
| Female drivers | 117,566,578 | 6,049 | 5.1 |
The study also provides information regarding the average height and weight of the driver at the moment of the collision, narrowing even more the demographic field: for men, the average height equals 5’10’’, while for women it’s 5’4’’, for a general, average of 5’9’’. Meanwhile, regarding weight, the average for men is 196 lbs, while for women is 162 lbs.
Therefore, it would be accurate to say that the demographic most likely to get into a fatal car crash are white males between 21 and 25 years old with an average height and weight of 5’10’’ and 196 lbs.
| Demographics most likely to get into an accident in the US | |||
| Metric | Male | Female | Both |
| Age | 21 – 25 | 21 – 25 | 21 – 25 |
| Age % | 11,13% | 10,96% | 11,09% |
| Height (ft) | 5’10’’ | 5’4’’ | 5’9’’ |
| Weight (lbs) | 196,04 | 162,77 | 188,47 |
| Race | White | White | White |
| Race % | 16,07% | 15,67% | 15,98% |
A spokesperson for Neufeld Lawfirm commented on the findings:
“The data shows how all over the US, the demographic which is more likely to get into a car accident are people between 21 and 25 years old, which is the second youngest category of drivers and many might think among the most reckless ones. However, it’s crucial to approach this topic with empathy and understanding rather than blame. Young drivers may face unique challenges as they navigate their newfound independence and learn to handle the responsibilities of being behind the wheel.”
“By recognizing this, it’s possible to focus on providing comprehensive driver education, mentorship programs, and increased parental involvement to help young drivers develop the necessary skills and knowledge to stay safe. Encouraging open communication, responsible decision-making, and promoting safe driving habits will benefit all young drivers and contribute to a safer driving environment for everyone”.
Anecdotally, and based on totally non-scientific data as experienced by this writer, the worst drivers in the U.S. are supposedly from New Jersey, according mostly to Pennsylvania drivers, and Florida drivers, according to almost everyone in Florida.
| Complete list of demographics more likely to get into a car accident in each US state | ||||||
| State | Age | % at Age | Race | % of Race | Average Height | Average Weight |
| Alabama | 26-30 | 11,35% | White | 69,44% | 5’9” | 184,34 |
| Alaska | 36-40 | 17,65% | White | 64,71% | 5’9” | 191,78 |
| Arizona | 21 – 25 | 12,65% | White | 79,07% | 5’8” | 184,28 |
| Arkansas | 31-35 | 11,59% | White | 75,78% | 5’9” | 188,59 |
| California | 21 – 25 | 13,83% | Unknown | 65,60% | 5’9” | 185,87 |
| Colorado | 26-30 | 11,59% | White | 86,91% | 5’9” | 180,65 |
| Connecticut | 36-40 | 15,35% | White | 73,95% | 5’9” | 145,67 |
| Delaware | 21 – 25 | 13,41% | White | 68,29% | 5’8” | 177,89 |
| District of Columbia | 21 – 25 | 33,33% | Black or African American | 83,33% | 5’10” | 165,39 |
| Florida | 26-30 | 11,93% | White | 77,65% | 5’9” | 178,92 |
| Georgia | 21 – 25 | 10,66% | White | 58,14% | 5’8” | 200,03 |
| Hawaii | 36-40 | 14,81% | White | 42,59% | 5’9” | 179,79 |
| Idaho | 26-30 | 11,79% | White | 90,26% | 5’9” | 182,23 |
| Illinois | 31-35 | 11,19% | White | 65,96% | 5’9” | 186,97 |
| Indiana | 31-35 | 11,59% | White | 78,83% | 5’9” | 192,55 |
| Iowa | 26-30 | 10,16% | Redacted | 100,00% | 5’10” | 197,59 |
| Kansas | 21 – 25 | 10,89% | White | 86,80% | 5’9” | 194,20 |
| Kentucky | 26-30 | 9,69% | White | 88,41% | 5’9” | 179,92 |
| Louisiana | 31-35 | 12,10% | White | 63,70% | 5’9” | 188,99 |
| Maine | 56-60 | 11,54% | White | 95,19% | 5’9” | 187,03 |
| Maryland | 31-35 | 15,54% | White | 36,07% | 5’9” | 184,04 |
| Massachusetts | 21 – 25 | 16,03% | White | 84,67% | 5’8” | 196,46 |
| Michigan | 21 – 25 | 11,05% | White | 76,03% | 5’9” | 194,27 |
| Minnesota | 31-35 | 12,32% | White | 83,38% | 5’9” | 193,43 |
| Mississippi | 21 – 25 | 12,57% | White | 54,86% | 5’9” | 185,39 |
| Missouri | 31-35 | 10,21% | White | 83,92% | 5’9” | 187,49 |
| Montana | 16 – 20 | 12,72% | White | 85,55% | 5’7” | 183,89 |
| Nebraska | 26-30 | 9,76% | White | 93,29% | 5’9” | 195,00 |
| Nevada | 21 – 25 | 12,92% | White | 82,08% | 5’9” | 189,26 |
| New Hampshire | 31-35 | 18,60% | White | 89,53% | 5’8” | 185,39 |
| New Jersey | 21 – 25 | 13,75% | White | 67,65% | 5’9” | 202,56 |
| New Mexico | 26-30 | 13,24% | White | 76,47% | 5’8” | 179,44 |
| New York | 31-35 | 11,75% | Unknown | 67,40% | 5’9” | 203,89 |
| North Carolina | 21 – 25 | 11,60% | White | 62,57% | 5’9” | 208,83 |
| North Dakota | 21 – 25 | 14,52% | White | 75,81% | 5’9” | 209,80 |
| Ohio | 31-35 | 10,68% | White | 79,07% | 5’9” | 191,37 |
| Oklahoma | 26-30 | 10,63% | White | 76,77% | 5’9” | 185,44 |
| Oregon | 31-35 | 10,10% | White | 90,64% | 5’9” | 191,55 |
| Pennsylvania | 31-35 | 9,78% | White | 55,68% | 5’9” | 176,59 |
| Rhode Island | 16 – 20 | 13,33% | White | 80,00% | 5’9” | 188,71 |
| South Carolina | 31-35 | 12,03% | White | 58,31% | 5’9” | 190,75 |
| South Dakota | 56-60 | 13,46% | White | 75,96% | 5’9” | 190,33 |
| Tennessee | 21 – 25 | 11,16% | White | 74,95% | 5’9” | 189,28 |
| Texas | 21 – 25 | 13,28% | White | 82,24% | 5’9” | 196,21 |
| Utah | 16 – 20 | 10,78% | White | 88,24% | 5’9” | 183,76 |
| Vermont | 56-60 | 12,07% | White | 93,10% | 5’10” | 194,24 |
| Virginia | 21 – 25 | 10,46% | White | 63,08% | 5’9” | 189,54 |
| Washington | 21 – 25 | 12,53% | White | 72,89% | 5’9” | 182,67 |
| West Virginia | 36-40 | 10,95% | White | 95,52% | 5’9” | 189,14 |
| Wisconsin | 16 – 20 | 9,50% | White | 88,55% | 5’9” | 194,33 |
| Wyoming | 26-30 | 12,05% | White | 85,54% | 5’10” | 195,97 |
Data sourced from Fatality Analysis Reporting System
(Source: Neufeld Lawfirm) / (Cover photo, Image credit: Sand Law)
Posted by Richard Webster, Ace News Today / Follow Richard on Facebook, Twitter & Instagram