States where home prices have increased the most over the last several years

Following the onset of the COVID-19 pandemic, the U.S. government reduced interest rates in an effort to boost our country’s economic health. The reduction of interest rates, combined with several other factors like Americans’ desire to abandon apartment-living and larger metropolitan cities in favor of buying homes in less crowded residential areas, created an increased demand for homes. With the changing economy, many sellers dropped out of housing market and kept their homes. With more buyers than sellers out there, house prices increased dramatically, according to Rent, Own Sell, New York.
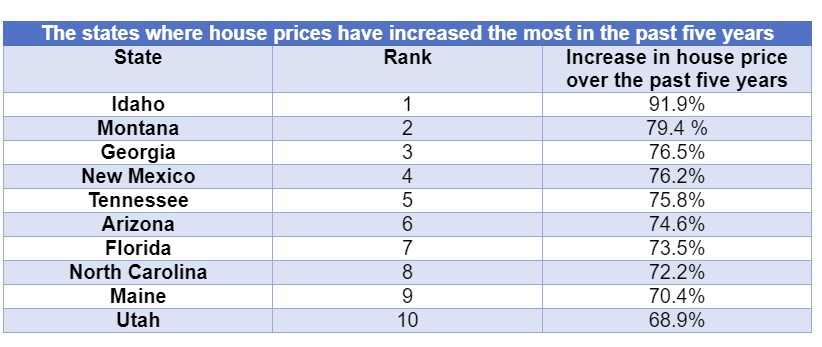
And now, a new study details where home sales prices have increased the most across America. Research by Boulder Home Source analyzed data from Zillow for the past five years, across all fifty states to determine which state had seen the largest rise in house prices.
The data revealed that the state with the highest increase in house prices is Idaho. There has been a 91.9% increase in house prices in the past five years in Idaho. The average house price in the state is currently $429,606.
Montana has seen the second largest increase in house prices out of all fifty states. The average house price in Montana is now $430,528 after increasing 79.4 % in the past five years.
The state with the third highest increase in house prices is Georgia. The average house price in Georgia is $301,978 after increasing 76.5% since 2018.

In New Mexico, there has been a 76.2% rise in house prices over the last five years, making the state have the fourth largest increase in house prices. House prices in New Mexico currently average at $272,195.
Tennessee has the fifth largest increase in house prices, rising 75.8% to an average of $291,334 in the past five years. Arizona and Florida rank sixth and seventh respectively. Arizona house prices have risen 74.6% in the past five years, the sixth highest increase of any state. In Florida there has been a 73.5% rise in house prices over the past five years, with Florida house prices currently sitting at an average of $377,816.


North Carolina follows closely behind Florida, as the state with the eighth highest increase in house prices. The average house price in North Carolina is $302,275 as of 2023 after rising 72.2% in the past five years.
Maine has had the ninth largest increase in house prices, rising 70.4% in the past five years to an average of $345,248. Utah ranks as the state with the tenth highest increase in house prices in the past five years, rising by 68.9% to $500,077.

Commenting on the findings, a spokesperson from Boulder Home Source said:
“The past five years has seen the housing market experience a lot of turbulence, leading to increases in house prices across America. This study offers a fascinating insight into the states where prices are more and less likely to experience volatile increases. This can serve as a useful guide to anyone looking to buy property in the next coming months or year.”
| State | Rank | Increase in house prices in the last five years | Average house price as of Feb 2023 |
| Idaho | 1 | 91.9% | $429,606 |
| Montana | 2 | 79.4% | $430,528 |
| Georgia | 3 | 76.5% | $301,978 |
| New Mexico | 4 | 76.2% | $272,195 |
| Tennessee | 5 | 75.8% | $291,334 |
| Arizona | 6 | 74.6% | $409,196 |
| Florida | 7 | 73.5% | $377,816 |
| North Carolina | 8 | 72.2% | $302,275 |
| Maine | 9 | 70.4% | $345,248 |
| Utah | 10 | 68.9% | $500,077 |
| Delaware | 11 | 67.1% | $349,010 |
| South Carolina | 12 | 65.0% | $269,424 |
| Kansas | 13 | 64.7% | $203,527 |
| New Hampshire | 14 | 63.7% | $417,207 |
| Indiana | 15 | 60.8% | $215,818 |
| Oklahoma | 16 | 59.0% | $183,733 |
| Washington | 17 | 57.6% | $553,846 |
| Missouri | 18 | 57.1% | $220,605 |
| South Dakota | 19 | 56.3% | $275,877 |
| Texas | 20 | 55.9% | $290,863 |
| Alabama | 21 | 55.8% | $207,145 |
| Ohio | 22 | 54.3% | $201,668 |
| Nevada | 23 | 54.1% | $409,008 |
| Vermont | 24 | 53.9% | $339,100 |
| Michigan | 25 | 53.7% | $214,710 |
| Nebraska | 26 | 50.9% | $234,304 |
| Kentucky | 27 | 50.8% | $188,241 |
| Rhode Island | 28 | 49.5% | $406,177 |
| Wisconsin | 29 | 49.4% | $256,359 |
| Colorado | 30 | 48.6% | $529,219 |
| Iowa | 31 | 47.3% | $193,341 |
| Oregon | 32 | 46.9% | $474,097 |
| Pennsylvania | 33 | 46.6% | $239,958 |
| Arkansas | 34 | 46.3% | $177,226 |
| California | 35 | 45.6% | $716,909 |
| New Jersey | 36 | 44.9% | $451,704 |
| Hawaii | 37 | 44.0% | $826,348 |
| Minnesota | 38 | 42.9% | $308,208 |
| Wyoming | 39 | 42.6% | $316,886 |
| Virginia | 40 | 41.9% | $351,581 |
| Massachusetts | 41 | 40.9% | $545,865 |
| West Virginia | 42 | 40.0% | $144,330 |
| Connecticut | 43 | 39.4% | $350,651 |
| New York | 44 | 39.3% | $629,516 |
| Illinois | 45 | 37.3% | $234.951 |
| Mississippi | 46 | 36.7% | $163,052 |
| Maryland | 47 | 33.9% | $382,154 |
| Alaska | 48 | 26.7% | $336,015 |
| Louisiana | 49 | 23.6% | $186,795 |
| North Dakota | 50 | 22.7% | $238,509 |
In contrast to the highest home prices, check out the video below to see where home prices are dropping the most.
Posted by Richard Webster, Ace News Today / Follow Richard on Facebook. Twitter & Instagram


